Depth Profiles
Layer systems
The most frequently applications of SIMS analyses are depth profiles. The figure shows depth profiles of the C, O, and Te concentrations in the InGaAlP-AlGaAs layer system of a LED. The concentrations are calibrated for the different layer materials, respectively.

Implantation profiles
As another typical application we provide depth profiles of elements implanted in a matrix, as shown in the figure for phosphorus in silicon. The high dynamics and the low detection limits of the method are indicated.

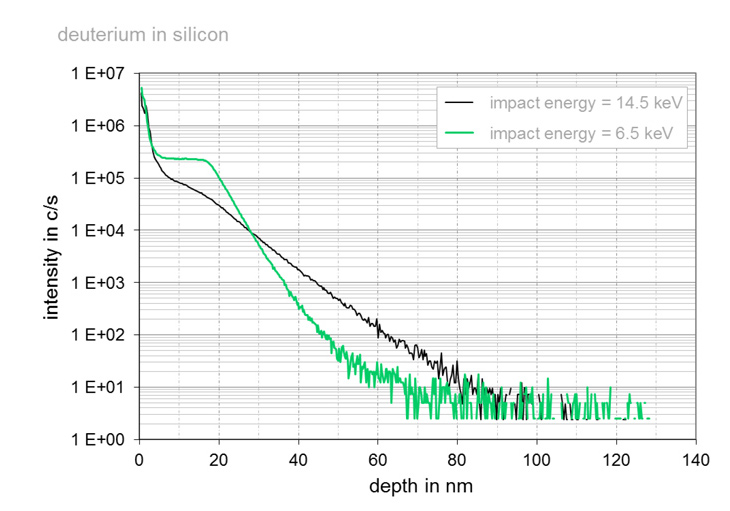
Depth resolution
Realizing high point densities the depth resolution is physically
limited by means of the impact energy. In every moment the intensity of
the secondary ions has its source in a volume element of the sample,
because there is a zone mixed by the primary beam. The smaller the depth
of this volume element the higher is the depth resolution at sufficient
high point densities. Usually there is no problem to achieve these
point densities. For decreasing the depth of the mixed volume element
the impact energy has to be decreased.
The figure shows this effect
on a sample with a narrow plateau of deuterium in silicon. Both profiles
are recorded on the same sample with different impact energies of the
primary beam: 14.5 keV (typically used) and 6.5 keV.
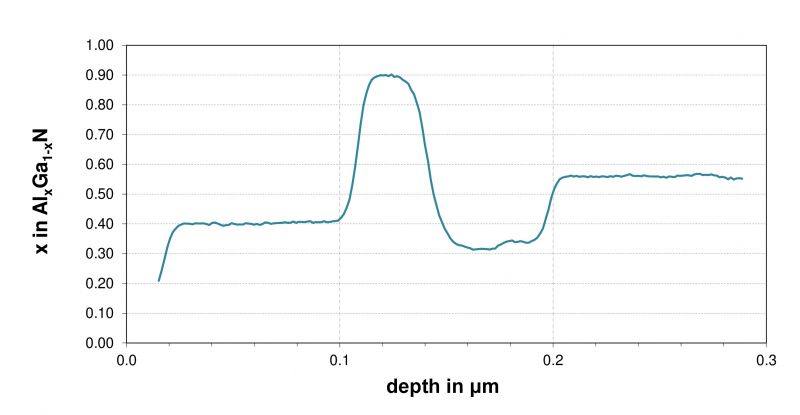
Concentrations of main components
Concentrations exceeding one percent are determined by SIMS as well (typically demanded as depth profiles). These analyses are performed in a different way from the analyses of dopants or impurities (concentration < 1%). The figure shows a depth profile of the molar fraction x of AlN in the system AlxGa1-xN. The maximum value is 0.90 (which corresponds to an Al concentration of 45 atomic percent).