Spacial element distributions
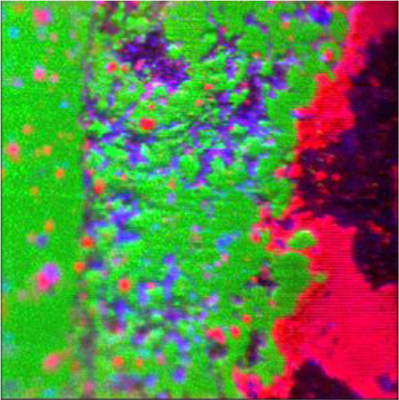
The spatial distribution of elements on a medical implant is visualized by means of colors – green for titanium, blue for sodium, and red for calcium. In the left part, the metallic implant is visible. Between the bone tissue (indicated by calcium) and the implant, there is a hydroxylapatite layer (indicated by sodium) which is interspersed with titanium. Taking into account the map edge length of 400 µm, the spacial resolution is in the order of a micrometer. By integrating several adjacent pixels, high detection probabilities on micro volumina are realized.
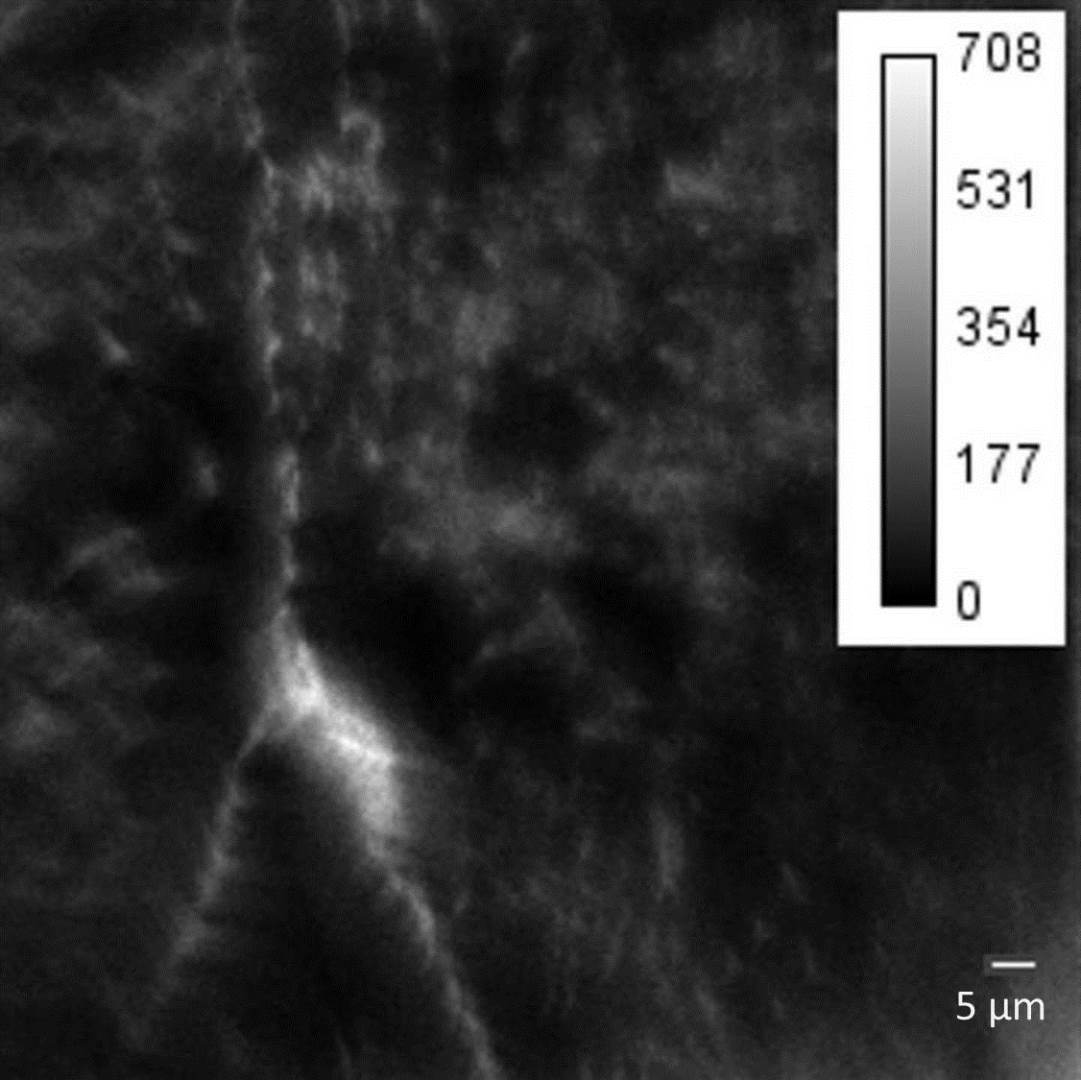
The adjacent figure presents the oxygen distribution at the surface of a platinium sample. The brightness of a pixel corresponds with the oxygen concentration at this position. Details of less than one micron dimension are resolved. The accumulation of oxygen close to the grain boundary is observable. The determination of concentrations is carried out by integration of the micro volumina of interest and the analysis of a calibration standard.
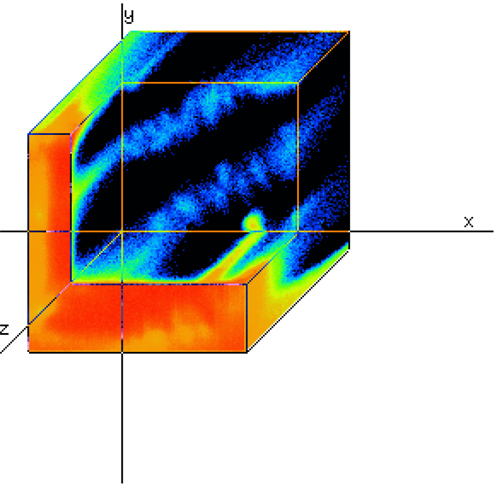
The successive recording of lateral resolved intensity distributions on an optional number of levels carried out during the sputter process provides a three dimensional distribution of chemical elements. This is shown in the figure for oxygen in silicon. The depth dimension is given by z. The integration of adjacent pixels enables respectively low detection limits.